
A quarter that is one fourth of the calendar carries a third of the money
The federal fiscal year runs from October 1 to September 30, and appropriated dollars generally do not survive it. That single rule shapes the whole buying calendar. If an agency has funds it has not obligated by September 30, the practical outcome for most accounts is that the money goes back. So the fourth quarter is when unspent balances get put to work.
Across FY2021 through FY2025, federal agencies obligated $3.58 trillion on prime contracts. Of that, $1.24 trillion landed in the fourth quarter, which is 34.6% of the total. If obligations were spread evenly through the year, a quarter would carry 25 percent. Q4 carries 1.59x what an ordinary quarter does.
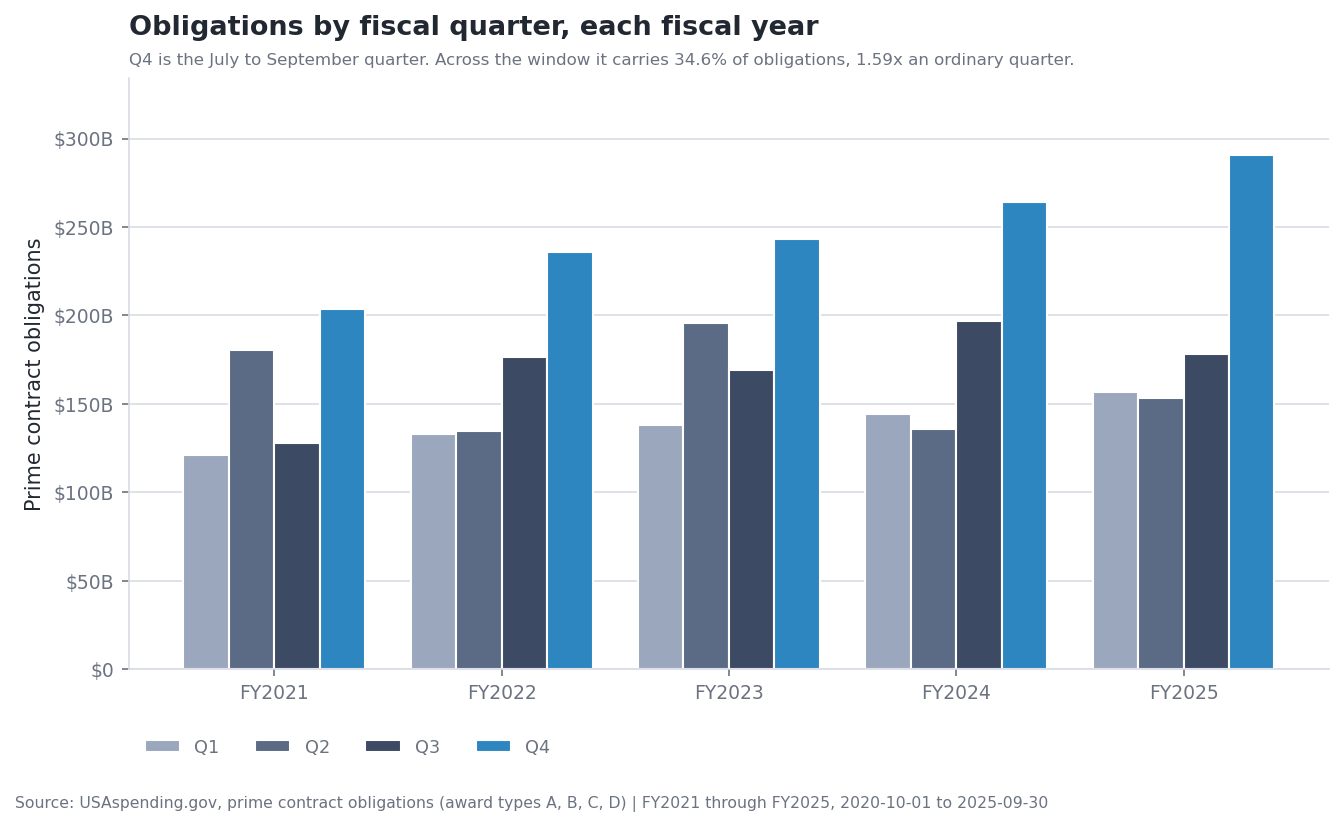
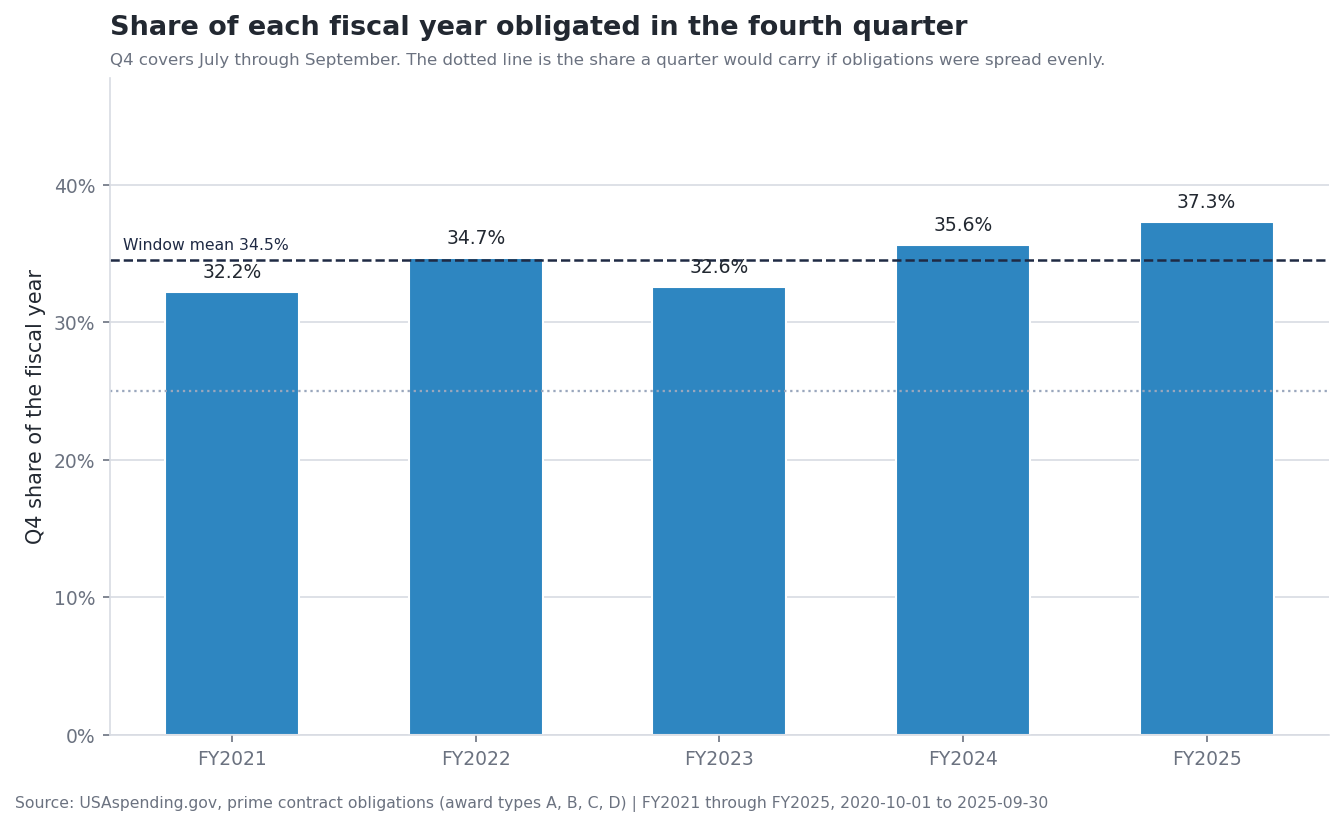
This is not one unusual year dragging an average. Q4 was the largest quarter in every fiscal year we measured. In FY2021, Q4 took 32.2% of the year. By FY2025 it was 37.3%, the highest share in the window. The shares do not climb in a straight line, but the range across the window runs from 32.2% to 37.3%, and every year sits well above an even quarter.
And most of the quarter is one month
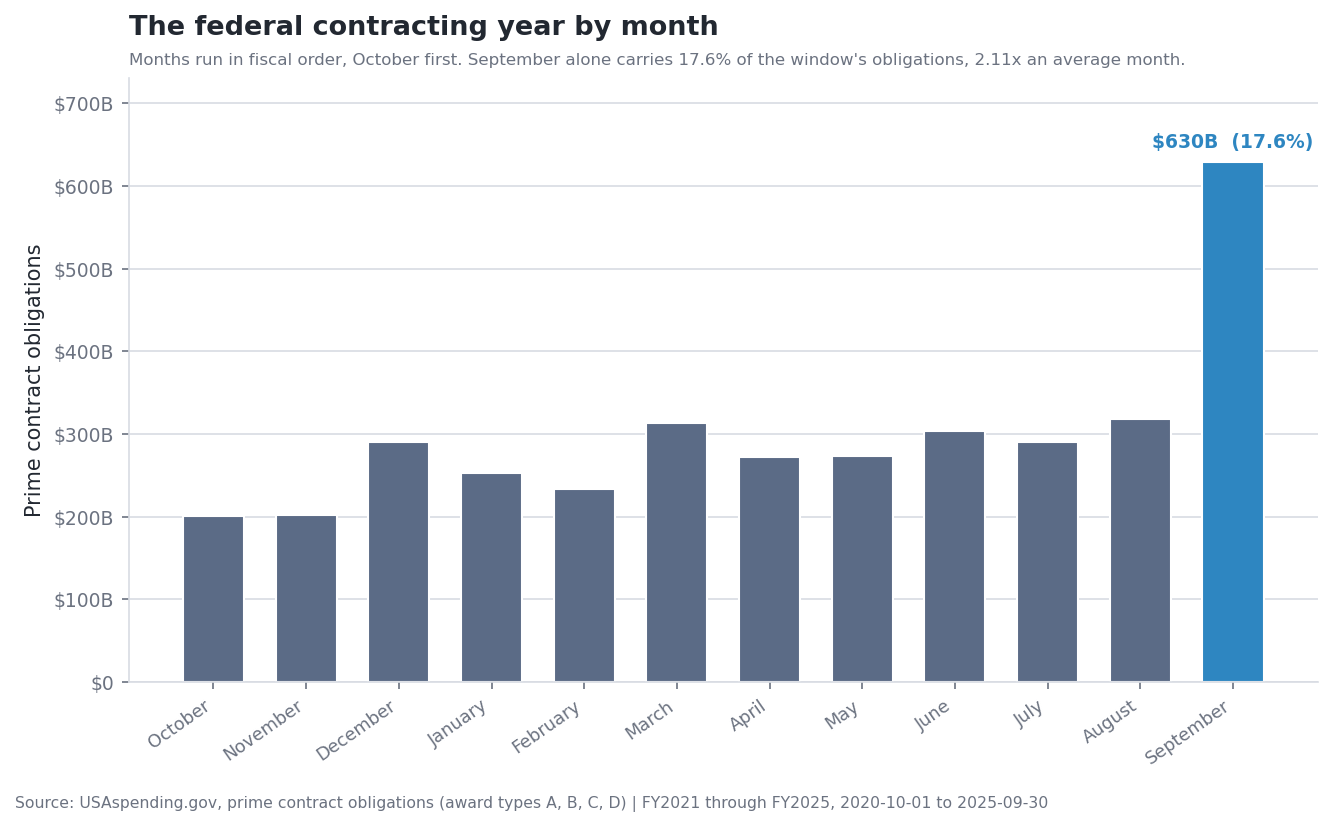
The quarterly view understates what is actually happening, because the fourth quarter is not uniformly busy either. Broken out by month, the federal contracting year has one enormous spike at the very end of it.
September obligations across the window came to $630 billion, or 17.6% of everything obligated in 5 years. The next busiest month, August, carries $318 billion, so September is 1.98x the runner-up and 3.14x October, the quietest month of the year at $200 billion. In an average year, that one month moves $126 billion. Measured against the quarter it sits in, September is 50.9% of the fourth quarter’s dollars.
Where the year-end money actually goes
An obligation is money going onto a contract. It is not the same event as a solicitation being posted or a new competition being won, and the dataset can be made to say which. USAspending records four prime award types, and two of them, delivery orders and BPA calls, are by definition orders placed against a vehicle that already exists. The other two, definitive contracts and purchase orders, are standalone instruments. Measuring each type on its own settles how the spike is built.
Orders on existing vehicles were 57.1% of all prime contract dollars in the window, and they concentrate harder at year-end than anything else: 38.1% of their dollars land in the fourth quarter, against 29.8% for standalone instruments. Put the two together and orders account for 63.0% of every fourth-quarter dollar, $779 billion across the window. The spike is not only larger for orders. It is mostly made of them.
What this means in practice
The September spike is mostly money flowing to companies that were already positioned when the quarter began: exercised options, incremental funding, modifications, and orders on vehicles they already hold. That distinction is the whole practical point rather than a footnote. It is a poor month to start introducing yourself and an excellent month to be easy to buy from. This data still says nothing about who won any particular award, and an obligation on an existing vehicle can still be a competed order.
Some buyers concentrate far harder than others
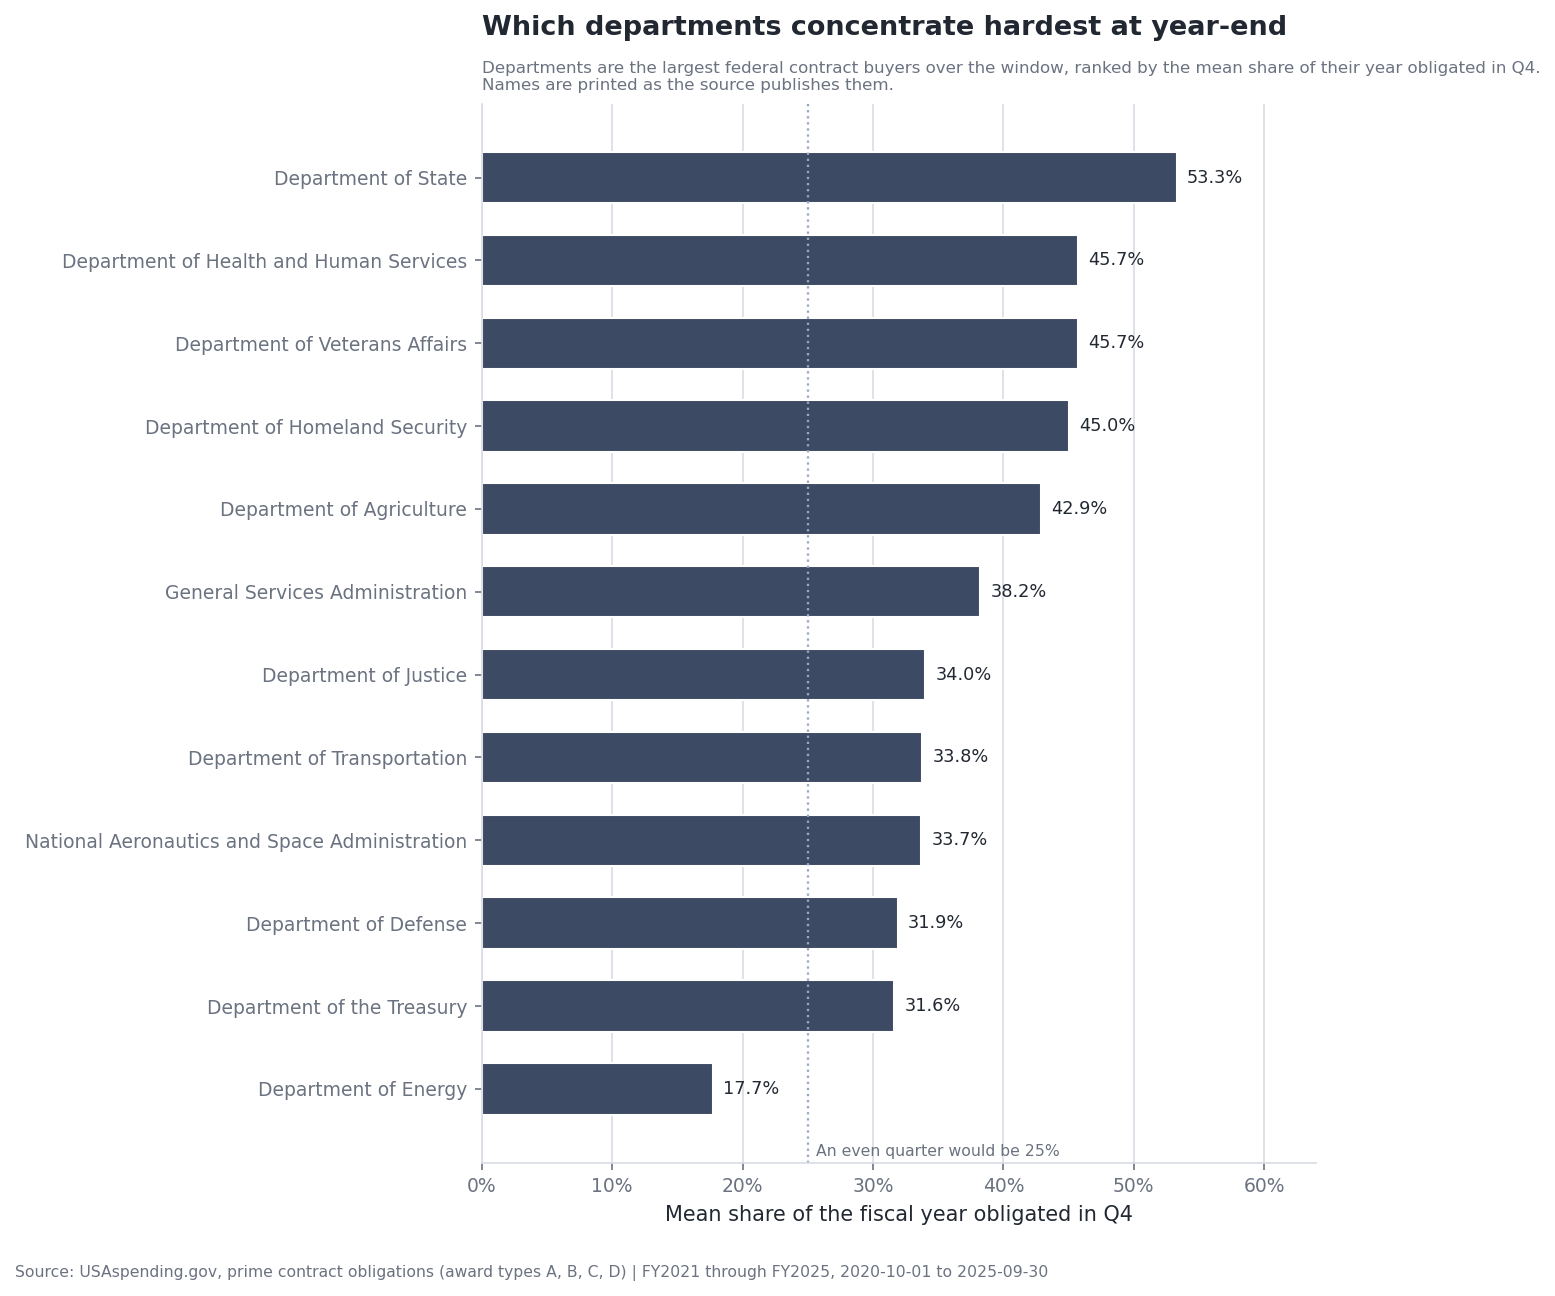
The government-wide number hides a lot of variation. We took the largest federal contract buyers over the window and measured each one separately. The spread is wide enough that a contractor selling to one department is in a genuinely different calendar from a contractor selling to another.
Department of State concentrates hardest: a mean of 53.3% of its contract year lands in the final quarter, so more than half its buying happens in three months, and 35.2% of it lands in September alone. At the other end, Department of Energy runs at 17.7%, which is below the even-quarter mark of 25 percent. It obligates less at year-end than during the rest of the year, so the year-end playbook does not apply there at all.
| Department | Obligations, FY2021 through FY2025 | Mean Q4 share | Q4 vs ordinary quarter |
|---|---|---|---|
| Department of State | $55 billion | 53.3% | 3.46x |
| Department of Health and Human Services | $152 billion | 45.7% | 2.50x |
| Department of Veterans Affairs | $311 billion | 45.7% | 2.42x |
| Department of Homeland Security | $116 billion | 45.0% | 2.52x |
| Department of Agriculture | $52 billion | 42.9% | 2.27x |
| General Services Administration | $113 billion | 38.2% | 1.87x |
| Department of Justice | $46 billion | 34.0% | 1.55x |
| Department of Transportation | $41 billion | 33.8% | 1.55x |
| National Aeronautics and Space Administration | $77 billion | 33.7% | 1.53x |
| Department of Defense | $2.20 trillion | 31.9% | 1.42x |
| Department of the Treasury | $47 billion | 31.6% | 1.39x |
| Department of Energy | $218 billion | 17.7% | 0.65x |
Ranked by mean Q4 share. USAspending.gov, prime contract award types A, B, C, D, FY2021 through FY2025 (2020-10-01 through 2025-09-30). FY2026 is in progress and is excluded.
What a contractor should take from this
Three things follow from the numbers above, and none of them is “work harder in September.”
- 1Your existing customers are where the year-end money moves. Orders on vehicles that already exist carry 63.0% of the fourth quarter, and the rest is weighted toward options, modifications and incremental funding on awards already made. The agencies already awarding to you are the ones most likely to obligate to you again before September 30. That makes your own award history the highest value list you own, and it is a list you can actually check.
- 2Your buyer decides your calendar. A contractor selling to Department of State at 53.3% faces a fundamentally different year from one selling to a buyer that spreads its obligations evenly. Know which one you are before you plan a quarter around a spike that may not apply to you.
- 3Positioning has to be finished before the quarter it pays off in. By the time a September action appears, the decisions behind it are usually made. The work that matters is done in July: knowing which of your customers are buying, what is open now, and whether your pricing and rate posture can survive a short deadline. If you are reading this in September, the honest use of the month is to be easy to buy from on the vehicles you already hold, and to start next year’s July now.
We wrote a companion piece that turns exactly that into a working checklist, with the product surfaces that answer each item: the FY26 year-end readiness checklist.
Sources and method
Source. USAspending.gov, the government’s own published federal spending data. Figures cover prime contract award types A, B, C, D, retrieved on 2026-09-10.
Window. FY2021 through FY2025, covering 2020-10-01 through 2025-09-30. These are the 5 most recent complete federal fiscal years. FY2026 is in progress and is excluded, because averaging a partial year into a year-end statistic would understate every share on this page.
Measure. Obligations, not outlays and not awards. Quarters and months are federal fiscal periods, so Q1 is October through December and Q4 is July through September. Department names are printed exactly as the source publishes them, with no relabeling.
Award types. The orders-versus-standalone split reads one series per prime award type. The type labels are coded from USAspending’s own award-type vocabulary for codes A through D, where BPA calls and delivery orders are the two placed against an existing vehicle; the figures are the source’s own. Each share in that split is taken over the four typed series summed, never across a second call.
Scope. Prime contract obligations only. This analysis says nothing about grants, and nothing about who won any particular award.
Repeatability. Every figure and chart on this page is generated by a script from the retrieved dataset with no manual transcription step, so the numbers in the copy, the numbers in the charts, and the numbers in the underlying data are the same numbers. Every qualitative claim about those numbers is derived from them at render time and is omitted when it does not hold. This piece is market analysis of published spending data, not legal or financial advice.
